
For many aspiring data scientists, mathematics is the “formidable gatekeeper”—a wall of dry formulas and intimidating Greek notation to be memorized just long enough to pass an interview and then buried behind a Python library. This phenomenon, often rooted in “Math Anxiety,” creates a barrier to true mastery. As a mathematical educator, I propose an antidote: viewing these foundations not as hurdles, but as intuitive, elegant tools for navigating a world defined by uncertainty. Understanding these truths is the precise boundary between a “coder” who merely executes scripts and a “data scientist” who understands the underlying mechanics of meaning.
The “Magic” of the Central Limit Theorem: Why Averages Are Your Best Friend

The Central Limit Theorem (CLT) is often described as possessing a “magical property” because of its universal reach. It states that if you take a sufficiently large sample (n) of independent observations from almost any distribution, the sample mean (Xˉ) will converge to a normal distribution. This holds true regardless of the original distribution’s shape—whether it was skewed, uniform, or bimodal—provided it has a bounded variance.
The mathematical heart of this magic lies in the relationship between the sample size and the precision of our estimate. While the distribution is centered at the true mean (μ), its variance is specifically σ2/n. This 1/n factor is the educator’s favorite lesson: as you collect more data, the “spread” of your potential error shrinks. This allows us to predict the behavior of incredibly complex systems without knowing every granular detail, relying instead on the predictable, tightening behavior of the average.
The “Probably Approximately Correct” (PAC) Mindset

In rigorous data analysis, “perfect” accuracy is a myth. Instead, we adopt the Probably Approximately Correct (PAC) framework, which formalizes the unavoidable trade-off between precision and certainty. This framework relies on two variables: ϵ (the error tolerance) and δ (the probability of failure). We define our confidence level as (1−δ), representing how often we expect our estimate to stay within the bounds of reality.
To use the PAC mindset is to accept the inequality Pr[∣Xˉ−μ∣≥ϵ]≤δ. Here, Xˉ is the random variable representing our sample mean, while μ is the fixed, underlying truth we seek to uncover. The “Truth” of the PAC mindset is that to achieve a smaller error (ϵ) or a higher confidence (1−δ), you must pay the price in data volume (n). Recognizing that we are only ever “probably” close to the truth is not a sign of weak analysis; it is the realistic gold standard of a scientist.
The Waiter Analogy: Understanding Markov’s Inequality Geometrically

Markov’s Inequality is a powerful tool because it requires almost no information about your data other than its non-negativity (X≥0) and its average. To understand its power, imagine the Geometry of the Markov Inequality through the analogy of a waiter balancing a tray. The probability density function (PDF) represents the weight on the tray, and the waiter’s finger must be placed exactly at the expected value (E[X]), which acts as the physical center of mass.
If the center of mass is fixed at a certain point, the physics of the tray dictate that only a small portion of the total mass can be placed very far from the finger before the tray tips. Mathematically, this provides a “weak” bound—meaning it is a loose upper bound—but its strength lies in its universality. By knowing only the “balance point” (the mean), we can guarantee that the probability of a value exceeding a certain threshold is strictly limited, even if we know nothing else about the distribution’s shape.
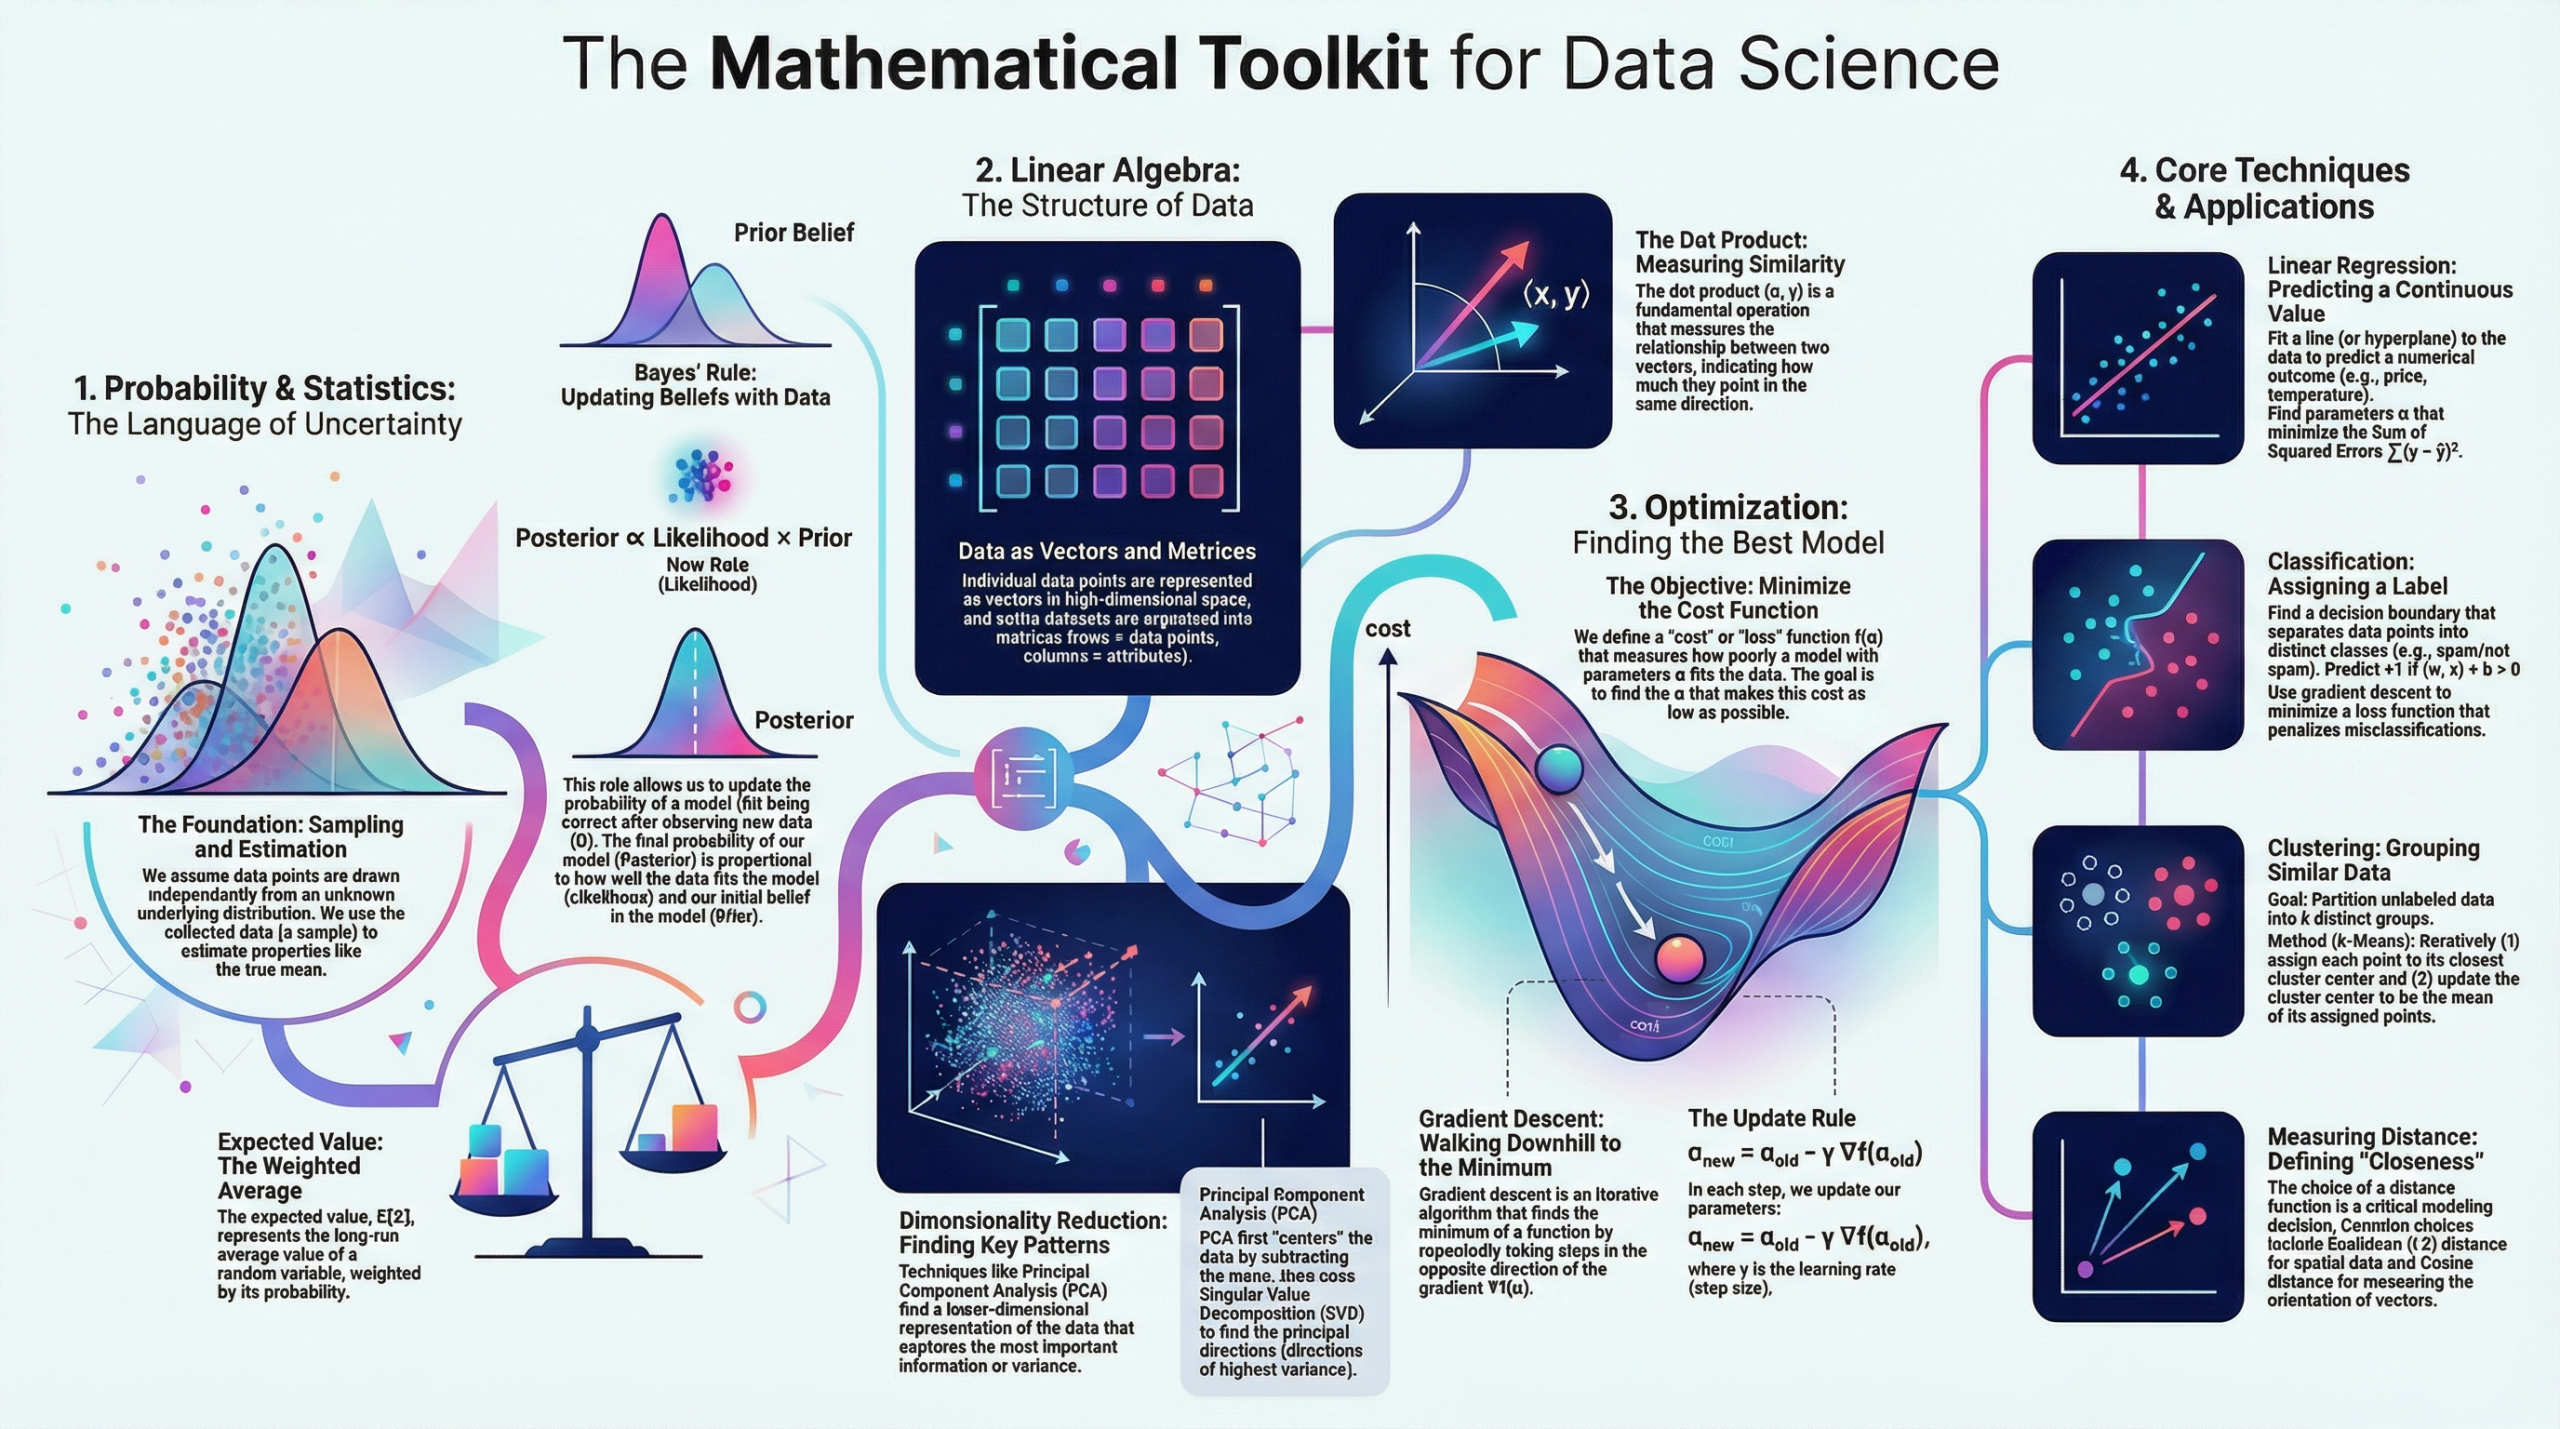
The Dot Product: More Than Just a Calculation

In introductory courses, the dot product is often reduced to a simple “multiply-and-sum” exercise. However, it is far more profound. As the source text notes: “The dot product is my favorite mathematical operation! It encodes a lot of geometry.” It is the fundamental way we measure how much one vector “aligns” with another.
The most vital geometric interpretation is the “shadow.” When we take the dot product ⟨u,v⟩, we are measuring the length of vector v projected onto the line of vector u. However, there is a critical mathematical prerequisite for this interpretation: u must be a unit vector (∥u∥=1). Only then does the dot product perfectly represent the geometric projection. By encoding angles and lengths into a single scalar value, this operation becomes the quiet engine behind similarity measures and dimensionality reduction in high-dimensional space.
The Power of Priorities: Why Sampling the “Important” Matters

Uniform sampling fails when data is imbalanced. Consider a Company Salary Estimation for 10,000 employees where one CEO earns $2 million and 9,999 workers earn $50,000. In a uniform sample of k=100, you will almost certainly miss the CEO, resulting in a massive underestimate of the average. The “Truth” here is that we must shift our dependency from the maximum possible value (Δ) to the average importance (Ψ/n).
This is the logic of Importance Sampling. We sample high-weight items (like the CEO) more frequently based on an importance value ψj, but we adjust their final contribution using the formula Ψ/nψj⋅w(aj′). This ensures the estimate remains unbiased while dramatically reducing the sample size k needed for accuracy. By prioritizing the “important” data points and down-weighting them to compensate, we achieve a concentration of measure that uniform randomness could never provide.
Conclusion: The Future of Data is Mathematical
Software tools and programming languages are ephemeral, but the foundational principles of Probability, Linear Algebra, and Sampling are constant. They provide the steady hand required to interpret a world that is becoming increasingly abstract.
As we move toward a future defined by “automatic decision making,” we must confront the ethics inherent in our equations. When the algorithm replaces the human, we must ask ourselves: who is responsible for the distribution’s tail? Understanding the mathematics is the first step toward answering that question; the second is the responsibility of the analyst to ensure the math reflects the human reality it purports to model.